| Location: | Home  Public Collection 1_Orphaned Files_1 June 2009 SPS/SPSN disk IO Utilization Investigati... sps-fpmaster 1 hour look at multiple stats Properties Public Collection 1_Orphaned Files_1 June 2009 SPS/SPSN disk IO Utilization Investigati... sps-fpmaster 1 hour look at multiple stats Properties |
DocuShare is now read-only. Use Google Drive.
| Location: | Home Public Collection 1_Orphaned Files_1 June 2009 SPS/SPSN disk IO Utilization Investigati... sps-fpmaster 1 hour look at multiple stats Properties |
The server is currently operating in read-only mode to allow routine maintenance operations to be performed.
Properties cannot be edited at this time.
| sps-fpmaster 1 hour look at multiple stats | |
This is hard to read at this size but is a plot of many statistics for about a 1 hour period post readahead change. While IO utilization and CPU wait percentages are higher than one would want, I think we can go ahead and try putting CNV interval back to normal. We still need to address the current loads though as this will only increase next year. | |
| Handle: | Document-50436 |
| Owner: | IceCube, Project (User-13, icecube:DocuShare)DS |
| Monday, June 22, 2009 01:56:19 PM CDT | |
| Monday, June 22, 2009 01:56:19 PM CDT | |
| Modified By: | |
| Locked By: | |
| Allowed | |
| JPEG Image (.jpg, .jpeg) - image/jpeg | |
| sps-fpmaster-20090621-063435_1.jpeg | |
| No | |
| 10000 | |
| 323655 | |
| No | |
| Appears In: | June 2009 SPS/SPSN disk IO Utilization Investigation |
| Preferred Version: | sps-fpmaster 1 hour look at multiple stats |
DocuShare is now read-only. Use Google Drive.
 Download
") Upload a New Version
Upload a New Version") Delete Document
Delete Document") Lock
Lock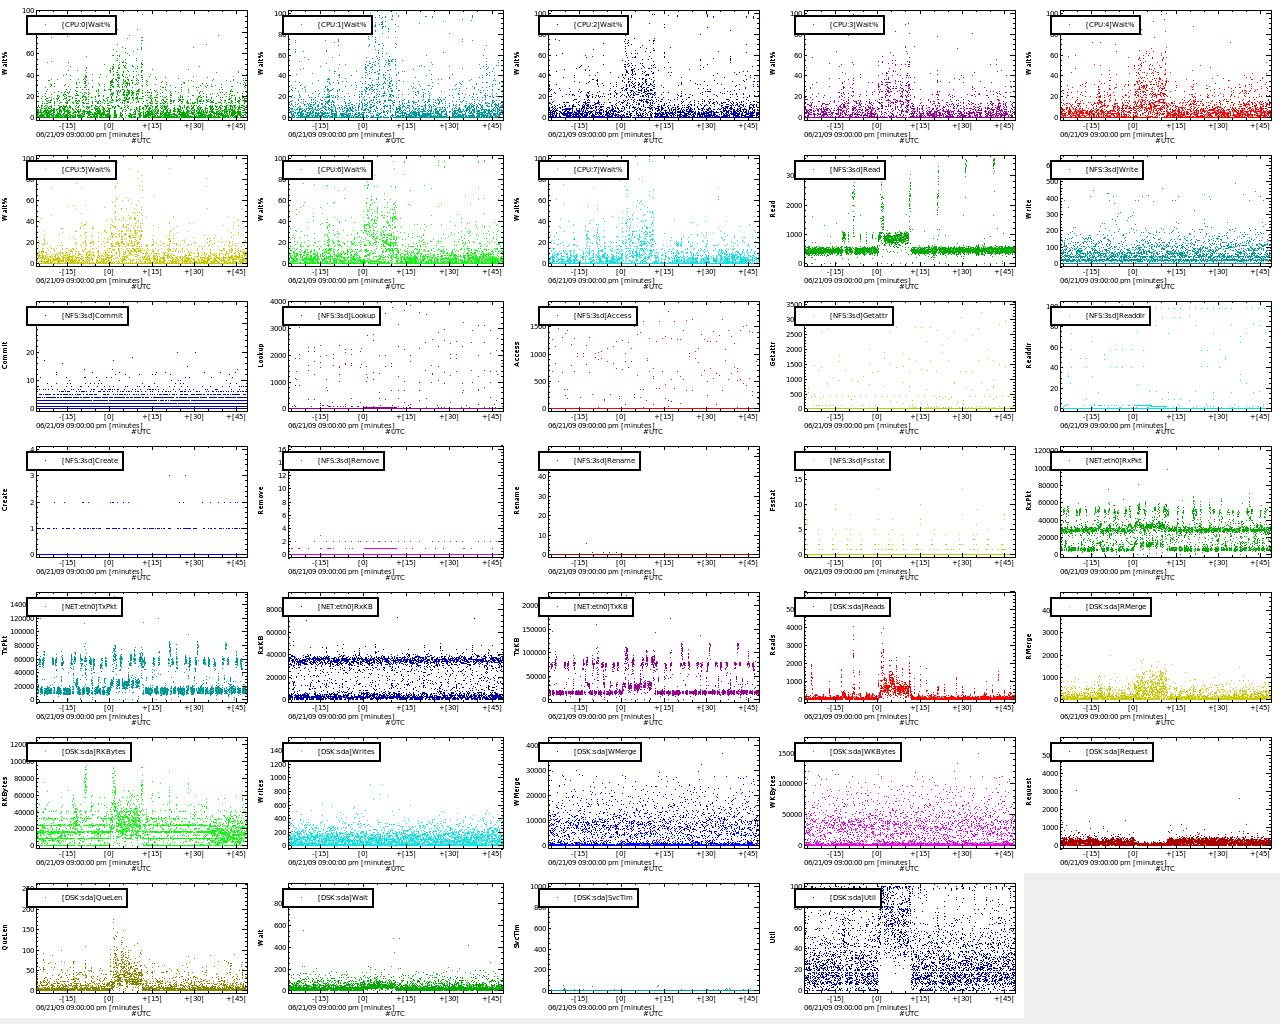